20071211 Pawnee + KCYS test dual Doppler operations
The CSU-Pawnee radar was operated between mid-October and mid-December 2007 in support of the ICE-L field project. During the morning hours of 11 December 2007, snow was falling over much of northeastern Colorado. The snow accumulation at KBJC delayed the takeoff of the NCAR C-130 until around noon. During this waiting period, CSU-Pawnee performed several volume scans in time synchronization with the Cheyenne WSR-88D radar (KCYS). The objectives of these scans were
- Test the dual Doppler wind field synthesis procedures based on radial velocity data recorded by Pawnee and KCYS
- Compare the reflectivity values observed by the two radars at common grid point locations.
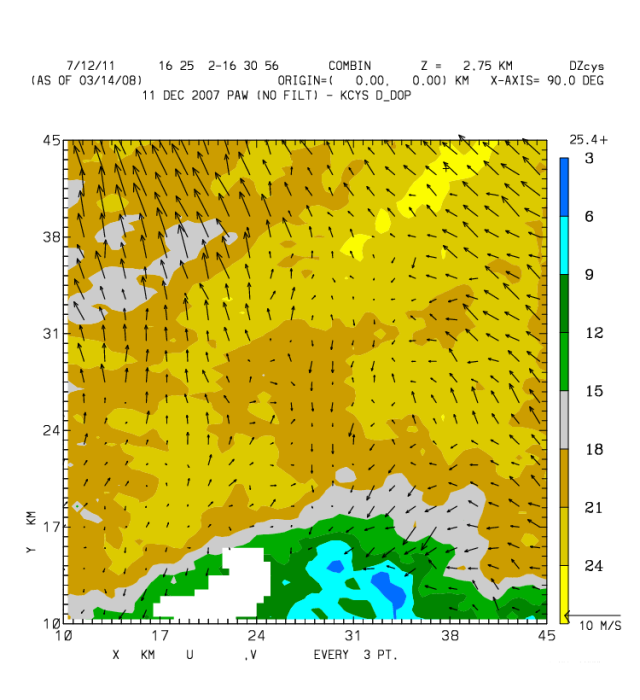
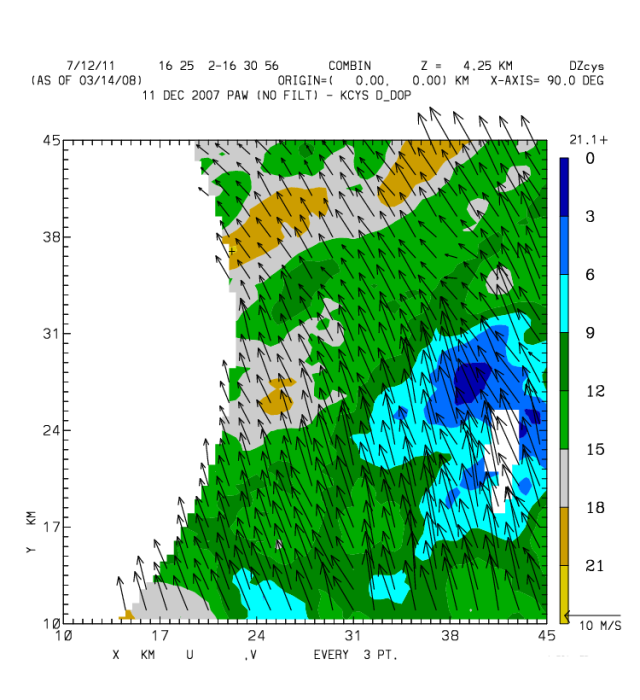
The following two CAPPI's show the horizontal Earth-relative dual Doppler wind fields at the 2.75 and 4.25 km MSL heights. (The ground elevation at Pawnee is approximately 1.6 km MSL.) The background color fill field is the KCYS reflectivity data; the grid origin is located at Pawnee. The lower level flow field is suprisingly complex with both local speed and direction variations noted at this height within the general "upslope" layer. At the upper level (4.25 km MSL), the wind flow has veered to a south-southeasterly direction and strengthened. (KCYS was only scanning up to an elevation angle of 4.5 degrees, so interpolations could not be done on the entire CAPPI plane.)
The next three vertical cross sections are east-west planes located along Y=37 km. The maximum KCYS reflectivity values are found at the lowest heights.
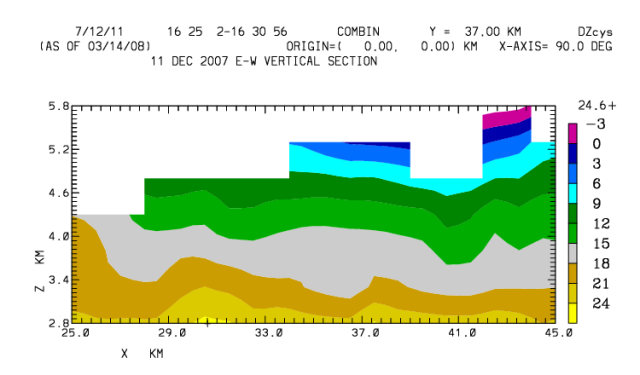
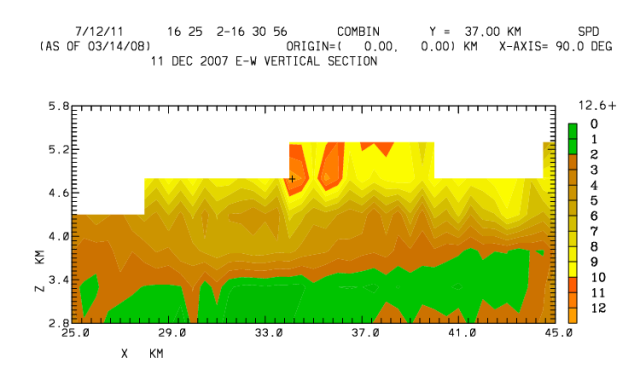
The color coding in the following cross section depicts the total horizontal wind speeds (mps) calculated from the dual-Doppler U and V components. Wind speeds are the lightest in the lower levels; speeds increase fairly rapidly above approximately 3.5 - 4 km MSL.
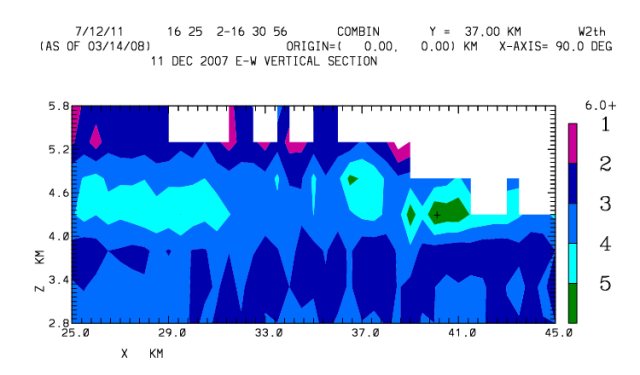
The final vertical section shows the Pawnee radial velocity spectral width field. A rather widespread layer of maximum spectral widths is found near the 4.25 km MSL height. (Note: this Pawnee volume scan was taken with the clutter filter turned off.) The high width layer seems to have some association with the areas where the horizontal wind speeds are changing the most rapidly with height.
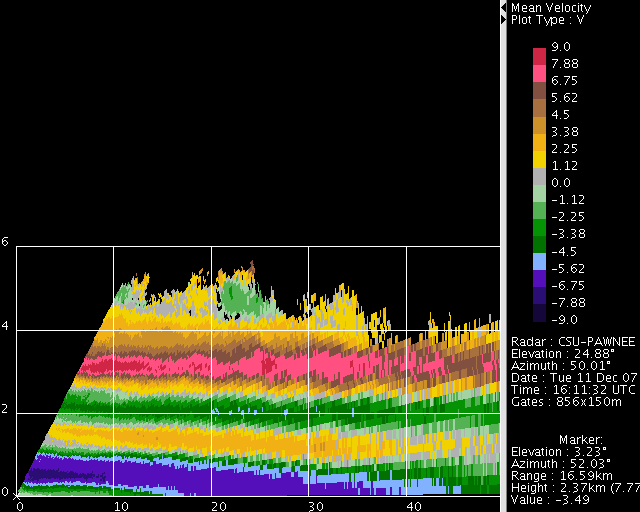
Pawnee RHI data taken along an azimuth of 050 degrees is shown below. As indicated by the cartesian grid vertical sections, reflectivity maximizes near the ground.
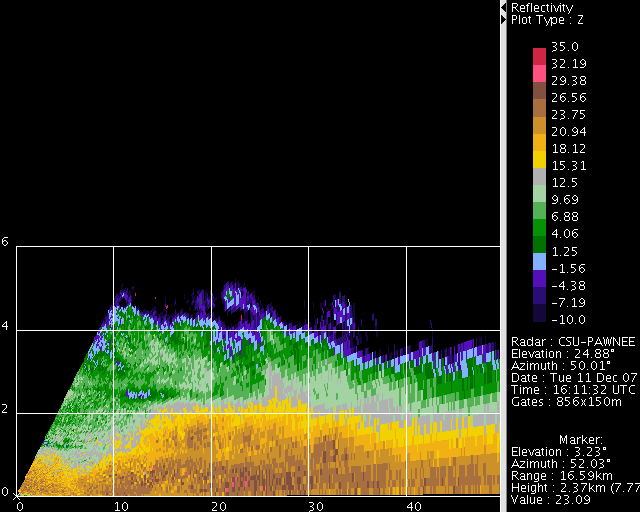
The radial velocity pattern is complicated by the embedded negative velocity layer centered near 2 km AGL. The maximum positive velocity layer near 3 km AGL (4.6 km MSL) is in the general area of the large spectral width layer seen in the cartesian grids.
Finally, the differences in the Pawnee and KCYS reflectivity values were averaged at each CAPPI height. The Pawnee reflectivities were found to be ~4dB below those reported by KCYS.
External Links
- Brief description of the ICE-L project
- ICE-L Field Catalog
